Napkin AI guide 2026: turning text into a usable diagram
Napkin AI solves a common problem: a team has useful text but cannot quickly turn it into a clear visual. Its official site describes a workflow where you paste or import text, generate visuals, choose the best version, edit elements and export the result. This guide focuses on getting a practical diagram, not just decorative graphics.
Quick verdict for a small team
Napkin works best as a step between notes and final material. It is not a strategy tool and it does not replace a designer for a high-stakes campaign. It is a fast way to reveal relationships, processes and arguments that would otherwise stay hidden in paragraphs.
- Strong for processes, comparisons, mind maps and simple data relationships.
- Weaker when the source text has no clear logic or too many exceptions.
- Best results come after shortening labels and checking hierarchy manually.
What the official source shows
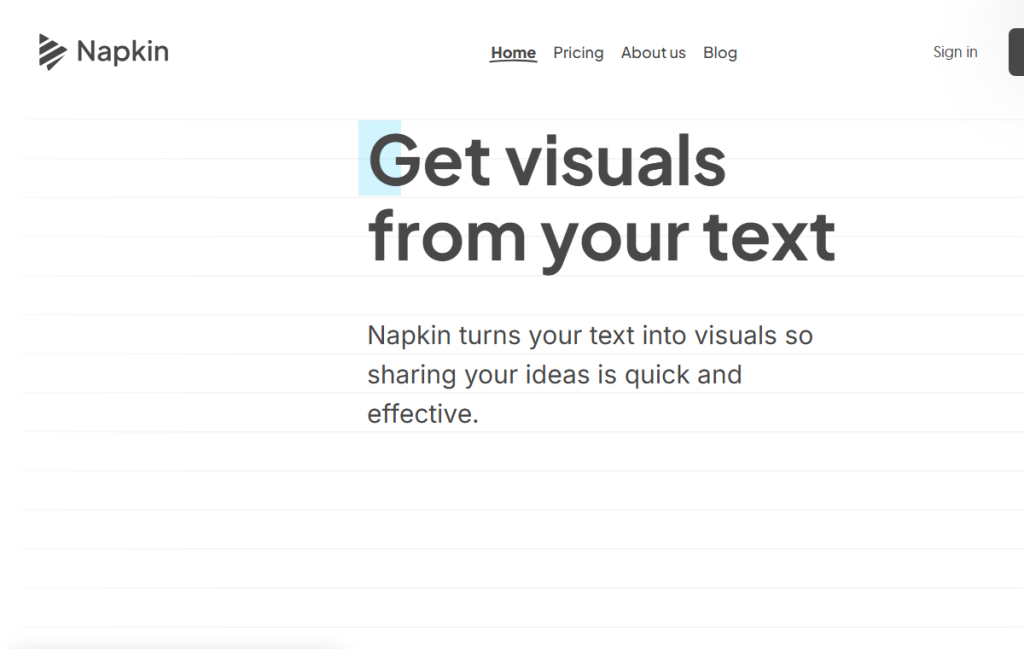
The official Napkin AI website says the tool works directly from text: import or paste, generate visuals, edit colors and elements, then export to PPT, PNG, PDF or SVG. The export choice matters because it determines whether the visual ends up in a deck, blog, documentation page or social post.
- PPT is useful for slide decks that still need editing.
- PNG is fast for blog posts and internal documents.
- SVG is better when a designer needs to refine shape and scale.
Where it makes sense in practice
In practice I would use Napkin when a process needs to be explained faster than a paragraph can do it: onboarding, internal methods, sales explanations, customer education or research summaries. A good input is not 'make an infographic', but short text with clear relationships.
- Rewrite a long paragraph into five to eight short sentences.
- Name the relationships: cause, step, risk, decision and output.
- Reject visuals that look attractive but do not explain anything.
Recommended workflow
The fastest workflow is simple, but it requires discipline. Napkin improves when you make it guess less.
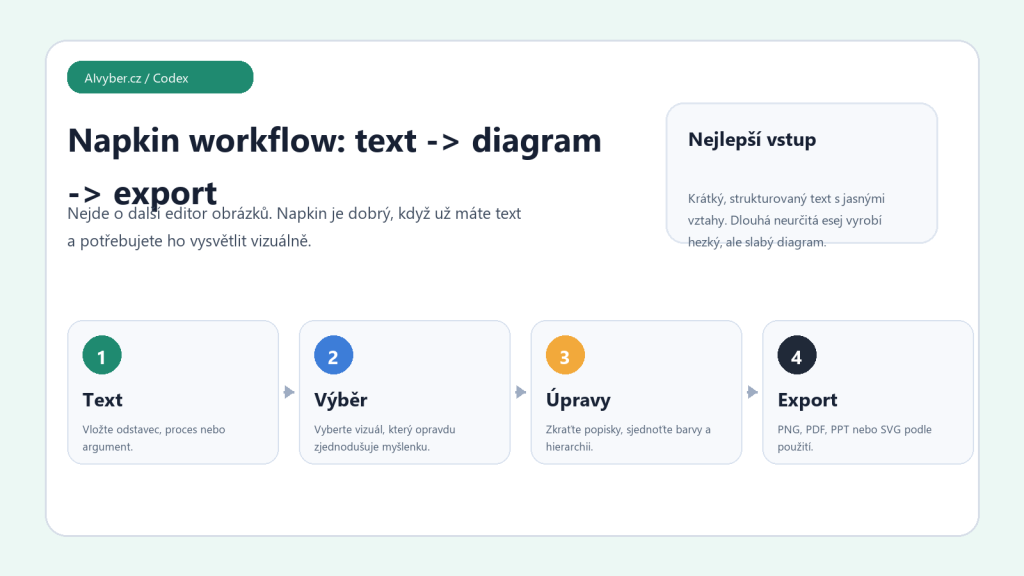
- Choose one idea, not a whole document.
- Shorten the input into standalone sentences with clear order.
- Generate several visuals and choose by clarity, not decoration.
- Edit labels so they remain readable on smaller screens.
- Export in the format required by the next step and keep the source text.
Limits and quality checks
Napkin cannot rescue text that lacks logic. If the input is full of vague claims, the output will become a generic illustration. For expert diagrams, you still need to check whether relationships distort the truth.
- Do not keep long sentences inside the visual.
- Check arrow direction, grouping and step names.
- Do not use the first generated option only because it looks best.
Who should consider it
Napkin is a strong fit for people who explain complex things often: product managers, consultants, marketers, teachers and internal documentation owners. Its value is not the automatic picture, but the structure it helps extract from text.
Recommended AI stack for implementation
| Service | Service description | Offer |
|---|---|---|
| NordVPN | VPN service for privacy protection and secure connections. | Open offer |
| Semrush | SEO and marketing platform for analysis and traffic growth. | Open offer |
| Notion | Workspace for notes, documentation, and project management. | Open offer |
| Hostinger | Web hosting and domains for fast website launch. | Open offer |
| Canva | Online design tool for graphics, presentations, and social media. | Open offer |
| Adobe | Creative tools for graphics, video, and digital content. | Open offer |
| Fiverr | Marketplace for freelancers and external specialists. | Open offer |
Note: We use affiliate links for listed services. If you purchase through them, we may earn a commission at no extra cost to you.
How to turn text into a diagram that is not just decoration
Napkin AI works best with short, structured text. If you paste a long paragraph full of detours, the tool may create an attractive but vague visual. Prepare 5 to 8 points with a clear relationship: process, comparison, hierarchy, causes and effects, or a decision tree.
- For a process, write the steps in order and name the input and output.
- For a comparison, separate criteria such as price, speed, control, export, and risks.
- Before export, shorten labels so the diagram remains readable in a presentation or article.
The most practical exports are SVG for further editing, PNG for quick article use, and PPT/PDF for presentations. Always check that the visual has not added meaning that was not present in the original text.
Useful links: Napkin AI, Napkin API documentation.